
Drivers
Dan Clarke
A professional race car driver who has driven in many racing series:
- Formula Ford
- British Formula 3 Championship
- Champ Car
- A1GP
- Indy Lights
- NASCAR
- Continental Tire SportsCar Challenge

Justin Green
Average track car enthusiast and owner of the test car:
- Professional Automotive Painter
- Avid track enthusiast
- Owner of two dogs
- Loves working on cars
- Gamer
What is Being Tested?
We tested 3 different wings on the same day, with the same vehicle, the same drivers, and on the same track.
- Competitor wing was tested at 10 degrees AOA with Gurney Flap
- Verus Engineering UCW Rear Wing (1 degree AOA for Dan Clarke, 6 degrees AOA for Justin Green)
- Verus Engineering High-Efficiency Rear Wing (12 degrees AOA for both)
1
2
3
Dan Clarke Wing Tests
Track Times
- Competitor Wing: 1.20.543
- UCW: 1.19.667
- High Efficiency: 1.19.386
Peak Downforce
- Competitor Wing: 431 lbs
- UCW: 419 lbs
- High Efficiency: 378 lbs
Average Lap Downforce
- Competitor Wing : 392 lbs
- UCW : 329 lbs
- High Efficiency : 226 lbs
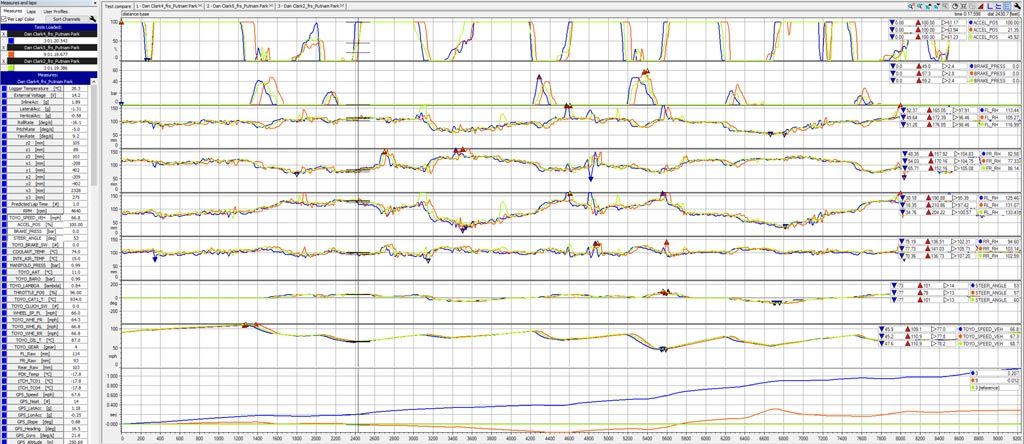
Blue – Competitor Wing, 10 Deg. AOA + Gurney Flap
Orange – Verus UCW Wing, 1 Deg. AOA
Lime – Verus High-Efficiency Wing, 12 Deg. AOA
Justin Green Wing Tests
Track Times
- Competitor Wing: 1.24.000
- UCW: 1.22.419
- High Efficiency: 1.23.090
Peak Downforce
- Competitor Wing: 300 lbs
- UCW: 244 lbs
- High Efficiency: 182 lbs
Average Lap Downforce
- Competitor Wing: 260 lbs
- UCW: 170 lbs
- High Efficiency: 139 lbs
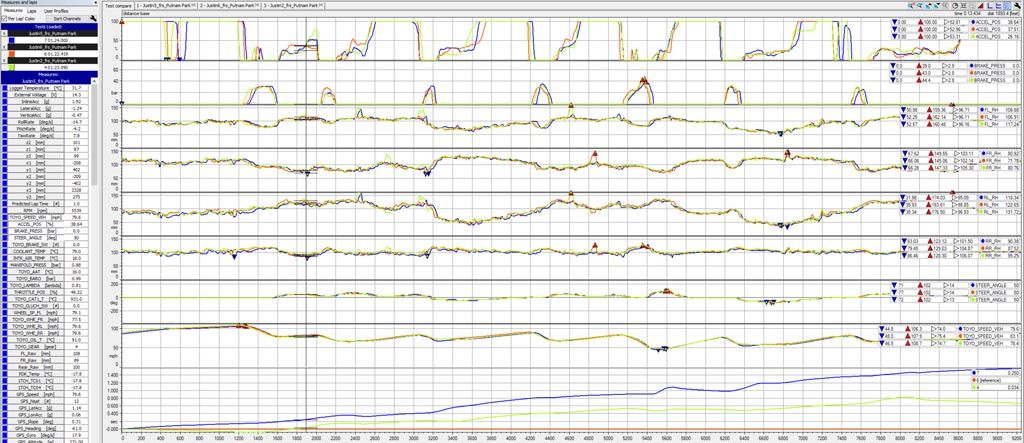
Blue – Competitor Wing, 10 Deg. AOA + Gurney Flap
Orange – Verus UCW Wing, 6 Deg. AOA
Lime – Verus High Efficiency Wing, 12 Deg. AOA
Conclusion
Dan Clarke
Track Times
- Competitor Wing: 1.20.543
- UCW: 1.19.667
- High Efficiency: 1.19.386
Peak Downforce
- Competitor Wing: 431 lbs
- UCW: 419 lbs
- High Efficiency: 378 lbs
Average Lap Downforce
- Competitor Wing: 392 lbs
- UCW: 329 lbs
- High Efficiency: 226 lbs
Justin Green
Track Times
- Competitor Wing: 1.24.000
- UCW: 1.22.419
- High Efficiency: 1.23.090
Peak Downforce
- Competitor Wing: 300 lbs
- UCW: 244 lbs
- High Efficiency: 182 lbs
Average Lap Downforce
- Competitor Wing: 260 lbs
- UCW: 170 lbs
- High Efficiency: 139 lbs
The competitor wing was at a higher angle of attack and had more peak downforce as well as average downforce with both drivers. Dan’s laps were more consistent, which means his values are closer to reality. What the data really shows is how efficient our wings are compared to the competition. The UCW Rear Wing, which was at 1 degree AOA, was producing a small amount less downforce than the competitor wing at 10 degrees, but much faster because it is an efficient design.
The most striking conclusion is that the amateur driver was faster with a more rear-biased aero balance than the professional driver. For Dan, the High-Efficiency Rear Wing was the fastest setup while for Justin, the UCW Rear Wing was the faster setup.