There is a wide range of CFD software available for use these days. We personally invest a lot of time and money, as a company, in the best engineering tools available for the development of products. At Verus Engineering, we have used ANSYS and OpenFOAM since the beginning of the company. The other common professional automotive CFD software is Siemens Star CCM+; which is commonly used by OEMs and Motorsport teams along with ANSYS and OpenFOAM. Professional CFD software allows the user to dictate necessary parameters to solve cases with accuracy while lesser software does not. Using a professional CFD tool is critical for the quality development of functional components. Without this type of tool, poor results will lead to poor decisions and sub-par functioning components.
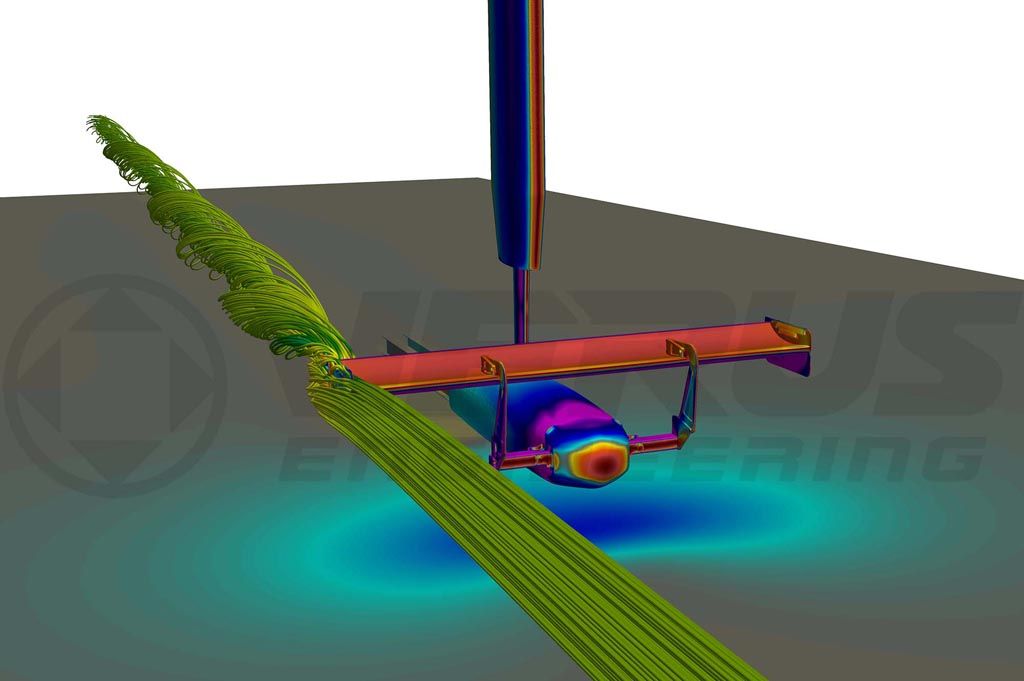
In this blog post, we compare the results of our 300mm chord rear wing with Non-Professional CFD Software (we will abbreviate this to NPCs for the remainder of this blog) and ANSYS Fluent. Keep in mind that this case is simplistic in comparison to full car analysis. The NPCs analysis was performed by an engineering student (our intern) with our help to ensure the results were as accurate as possible. The ANSYS Fluent case was set up and ran internally. We also know our ANSYS Fluent analysis correlates with the wind tunnel results (shown here), so we know the analysis setup is accurate. We will first go over the setup of each case, the numerical data, and then post-processing photos, showing the differences along the way.
Setup:
ANSYS Fluent
We used a polyhedral mesh of around 3 million cells with 20 prism layers with a targeted y+ less than 1. This is to solve the viscous sublayer with a k-omega SST turbulence model. The solver is a coupled solver using dual precision using 2nd order spatial discretization. We monitored residuals; continuity, x-velocity, y-velocity, z-velocity, k, and omega. Not only did we monitor residuals, but we also monitored the coefficient of drag/drag force and coefficient of lift/lift force.
NPCs Flow Simulation
NPCs do not give the ability to set up the analysis in the way more proper CFD software would allow. There is not an option to add prism layers which is ideal to capture the boundary layer. Capturing the boundary layer is critical for force calculations. There is no option to change the turbulence model so you are stuck with the Lam-Bremhorst k-epsilon model, which is not ideal for automotive external aerodynamics. There is no adjustment in the solver or discretization schemes. The only monitors are force monitors and not residuals. Without monitoring residuals, we do not know if the solver has fully converged or not. All of these inabilities and unknowns reduce accuracy and correlation to real-world results.

Looking at the data, NPCs do not correlate to ANSYS Fluent, which we know correlates to real-world results. Ultimately, NPCs did not capture the performance of the wing at all, which is a simplistic case when compared to an entire vehicle model. The drag and downforce numbers are not close to the actual performance of the wing; nor is the L/D.
Post Processing Image Discrepancies

Wing Underside
There is trailing edge separation which is apparent in the ANSYS Fluent case but completely missing in the NPCS case. We believe this to be a large source of the error for the NPCs analysis. Trailing edge separation does not mean a lack of performance as our wing is capable of producing more downforce at even higher AOA due to the specific geometry we developed.
Outside Endplate
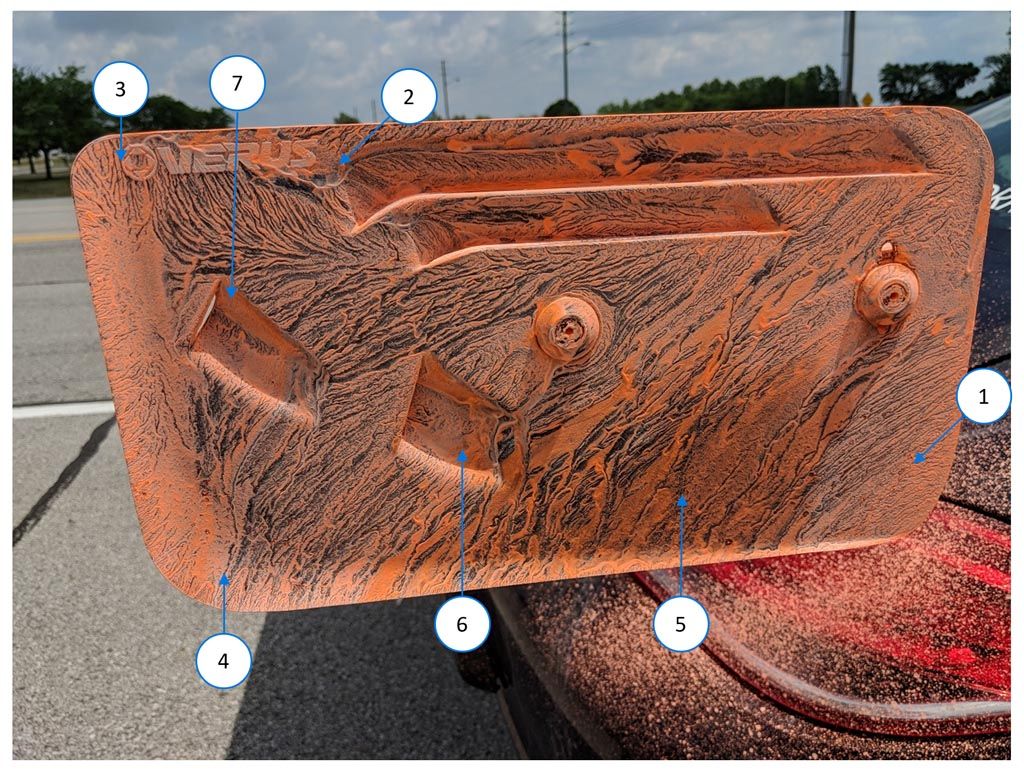
Overall, the flow on the outside of the endplate does not correlate from analysis to analysis. We know the Fluent case provides accurate results to the real world from flow vis testing; so once again NPCS falls short here. Below we have outlined various locations on the endplate stating the differences we see.
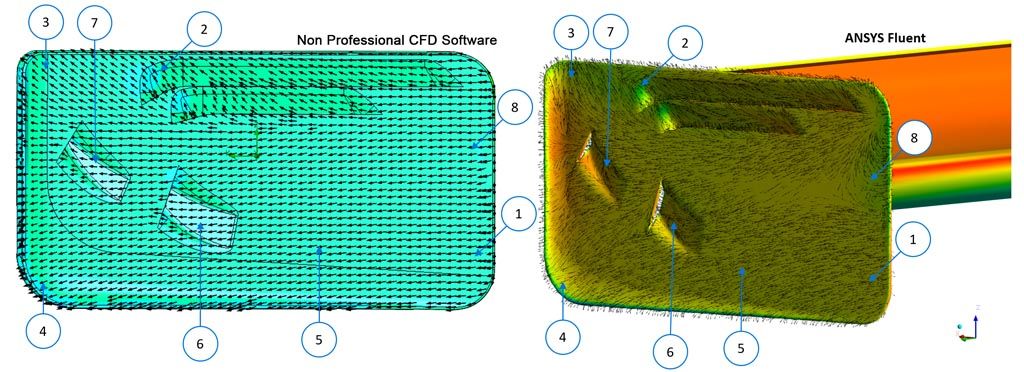
1. The flow in NPCS is going directly rearward. The flow in ANSYS Fluent is going downward and rearward at around a 45-degree angle.
2. This is the one area where the correlation between the cases was close. This would be expected because of the high-pressure gradient in this area.
3. The NPCs flow is incorrect here. The flow is much more vertical which is captured in Fluent analysis and flow viz but not by NPCs.
4. The flow in NPCS is still wrong. It is slightly going down while the flow in Fluent is going down around 45-50 degrees.
5. The flow here is still wrong in NPCS where I would have expected it to be more correct. In NPCs, it is slightly going down where the actual flow is around 30 degrees downward
6. The flow is not shown using the first vent in the NPCS analysis. In the Fluent analysis, the flow can be seen entering into the vent.
7. The NPCs analysis does show some movement into the vent, but very little. This one is more accurate than #6, but still does not correctly show the behavior of the fluid.
8. The NPCs analysis does not capture the separation of the leading edge of the endplate like fluent.
Inside Endplate
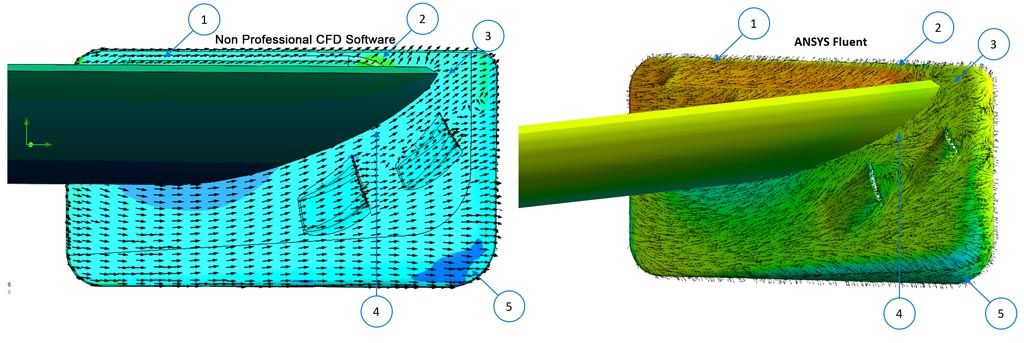
1. The NPCs flow is incorrect as it shows flow going rearward while it is actually going upward.
2. The NPCs flow is closer to being correct here but still does not represent the flow like Fluent. The flow is more upward than NPCS shows in the visualizations.
3. This specific spot is where NPCS is off by a large margin. The arrows are showing that the flow is attached and flowing with the wing. In reality, we have a separated flow that is actually going in the reverse direction.
4. This is another area that is off considerably. The NPCs flow shows attached flow when in reality, it is detached by the end plate here with some reverse flow.
5. This area is pretty close and any error could be from the arrow density.
Conclusion
If designing performance components matters and design choices are dictated from CFD data; it is imperative to have accurate and realistic analysis to make the best choices possible. The endplate and overall wing profile may have varied *substantially* if we were using non-professional CFD software for development as it would have lead us down incorrect paths due to the data and post-processing images. Professional CFD tools allow the users to correctly dictate necessary simulation conditions that lesser CFD tools do not. As can be seen, by a simple wing analysis, these small deviations between cases can lead to vastly different analysis results in both post-processing images as well as the actual performance.
CFD Tools