Verus Wind Tunnel Results
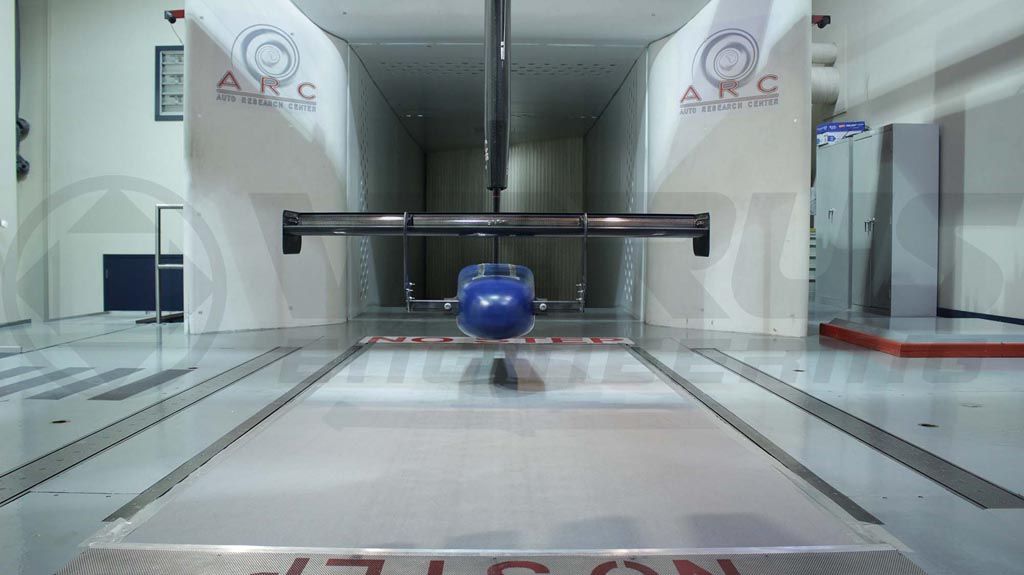
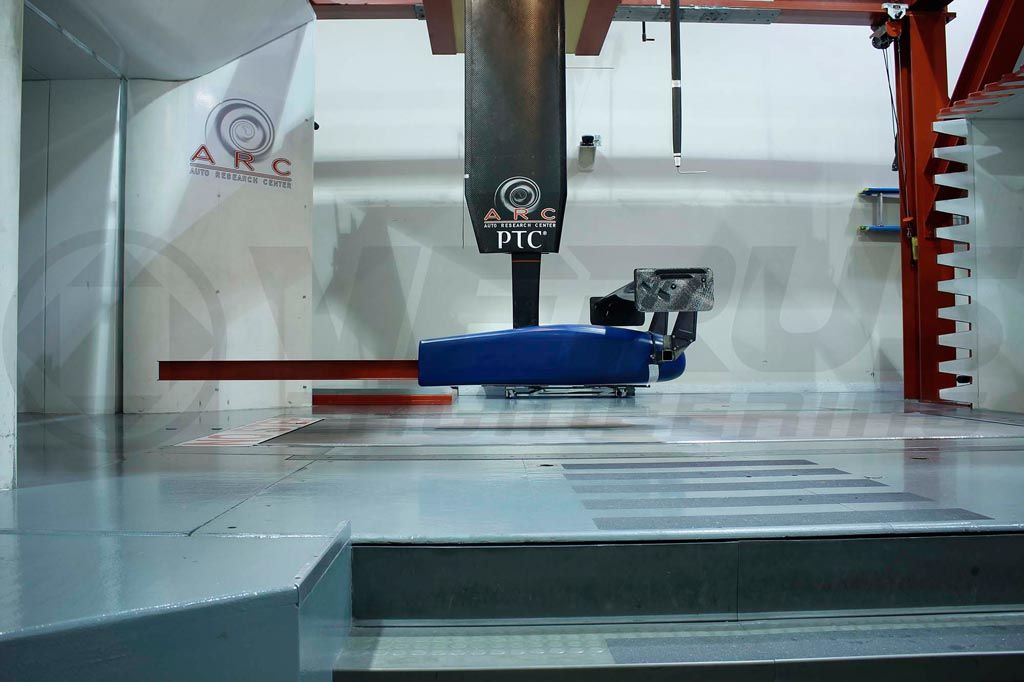
A few weeks ago, Verus went to the wind tunnel with the goal of validating our CFD analysis. We tested at Auto Research Center Indianapolis (ARC Indy) using their wind tunnel for full-scale wing testing. Two of our rear wings were tested, along with 4 other wings from various other small businesses/privateers, using fixtures designed and built in-house. Today’s blog will go over our results and findings from the wind tunnel.
Why Does Validation Matter?
Validating our CFD to wind tunnel data ensures that our test procedures within CFD are accurate and reasonable. CFD can run incorrectly very easily, and we wanted to make certain that our results within CFD estimate real-world numbers.
How Did We Run CFD to Compare to the Wind Tunnel?
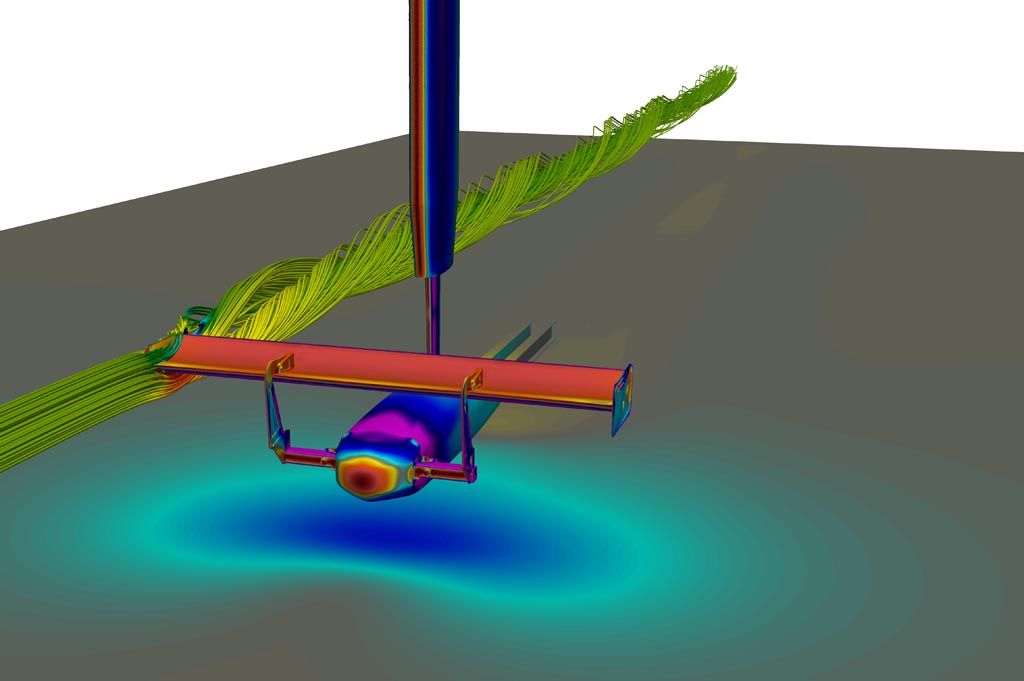
Unfortunately, it is physically impossible to test a rear wing in free-stream airflow, which is how we developed our wing profile. The wing needs a way to be held up in the wind tunnel; so to correlate our results from CFD to the wind tunnel; we had to model and CFD the entire sting at the correct height off the tunnel floor. The wind tunnel tests were run at ~80 MPH or 36.5 meters per second.
Mesh generation, analysis, and post-processing were handled by ANSYS. The mesh for this run was a bit over 40 million cells. The wing had 20 prism layers with a first cell height of 0.005mm to capture the viscous sublayer. We ran the wing through our main (3) turbulence models, K-Omega SST, K-Epsilon Realizable, and Spalart-Allmaras. We primarily use K-Omega SST in our analysis; but, presented a chance to improve our processes, we tested three.
Verification and Validation - Downforce
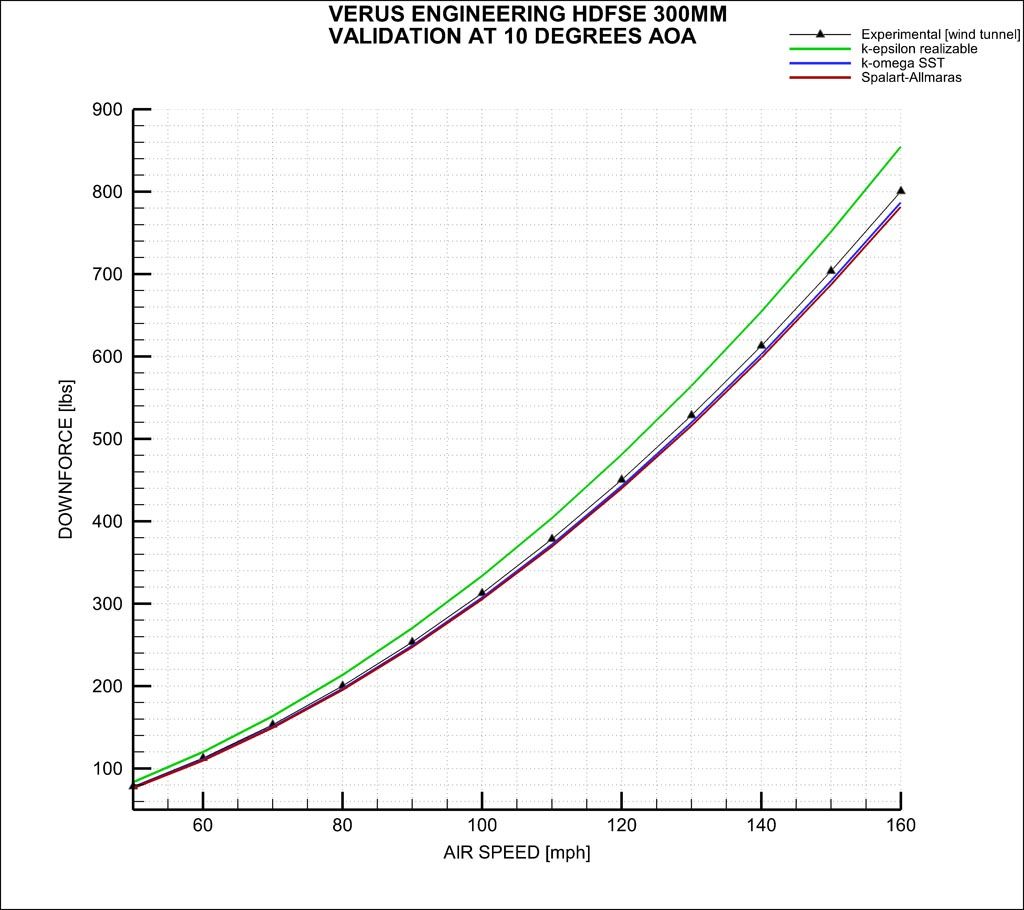
The graph below shows downforce for the experimental data (wind tunnel) compared to our CFD with different turbulence models applied. The analysis using the K-omega SST turbulence model was the closest to the wind tunnel results. Comparing this data; our CFD analysis underestimated downforce by 3.4lbs at 80 MPH; 7.5lbs at 120 MPH, and 13.4lbs at 160 MPH.
Verification and Validation – Drag
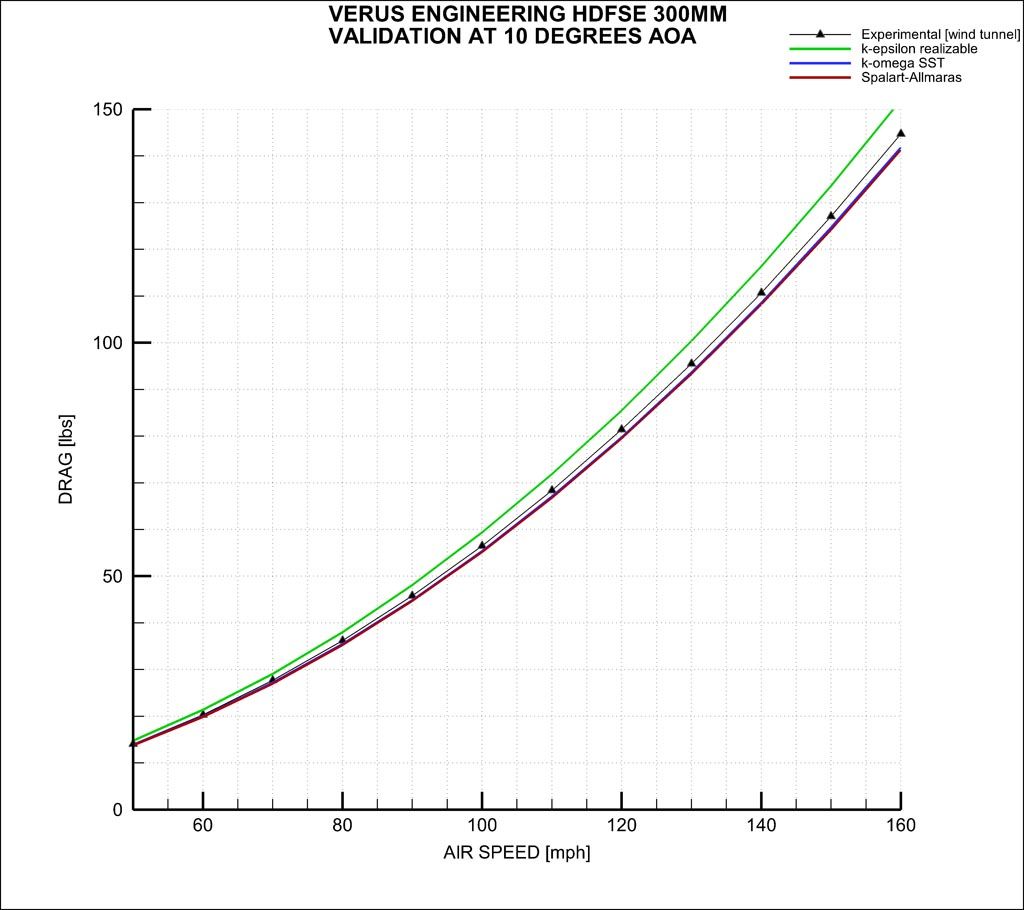
The graph below shows drag for the experimental data (wind tunnel) compared to our CFD with the same turbulence models above. The analysis using the K-Omega SST turbulence model was again the closest to the wind tunnel results. Comparing this data, our CFD analysis underestimated drag by 0.7lbs at 80MPH, 1.6lbs at 120 MPH, and 2.8lbs at 160 MPH.
Verification and Validation - % Difference
The below spreadsheet shows the downforce and drag coefficients for each simulation; with the percentage difference between the CFD analysis and the wind tunnel results.

Conclusion
With under a 2% difference from our CFD analysis to the wind tunnel; we are ecstatic with the results correlating so well. This really helped us solidify our analysis procedure and ensure what we do for each analysis is indeed correct and correlates to real-world results.
Verus Wind Tunnel Results