We use various post processers here at Verus; including CFDPost from ANSYS and open source, one called Paraview. In this blog, we will be using Paraview to look over some of the common images we at Verus look at to improve the aerodynamic performance of our components. All meshing and analysis were performed in ANSYS Fluent.
Pressure Coefficient Plot
The first post-processing plot is a vehicle Pressure Coefficient (Cp) plot. This is used to view the pressure quickly and easily on the vehicle’s surface. Ultimately, the pressure the vehicle’s surfaces see determines the downforce, lift, and drag of the vehicle. This is a very important plot and something we use in all analyses.
A pressure coefficient is a dimensionless number that describes relative pressures throughout the flow field. The pressure coefficient is very commonly used in external aerodynamic cases.
0 – is atmospheric pressure
0 – 1 is higher pressure
-1.0 – 0 is lower pressure
For any math inclined people, the equation of how you get to pressure coefficient is below:

In our post-processing, we make it easy to tell areas of high and low pressure due to the color plot. High pressure is yellow to red while blue to purple is low pressure. Grey is atmospheric pressure (freestream) so it would be areas of no effect on the surface of the car.
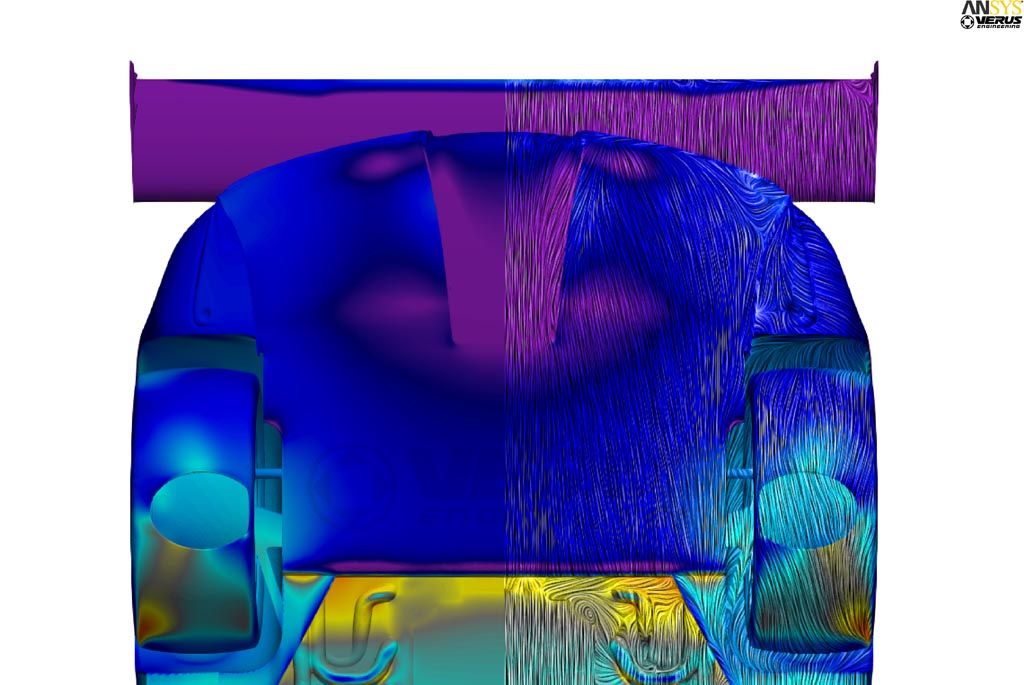
We are looking at the general pressure contour on the surface of the car using the pressure coefficient. The low pressure is very easily seen on the bottom side. Close up on the rear diffuser, you notice the low pressure on the throat of the diffuser. You can also see the very low pressure on the underside of the wing. Higher pressure can be seen around the simplified engine area.
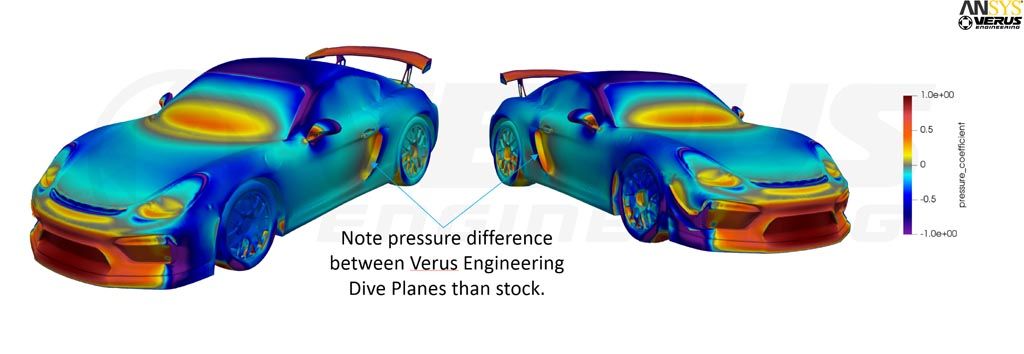
The dive planes have low pressure on the bottom side and around the bumper in this area. This is caused by the dive planes themselves and the relatively high velocity that is around the side of the bumper. This high velocity is one of the reasons dive planes or canards can have high angles of attack and keep flow attached. This plot also shows the higher pressure on the inlet ducts from these dive planes.
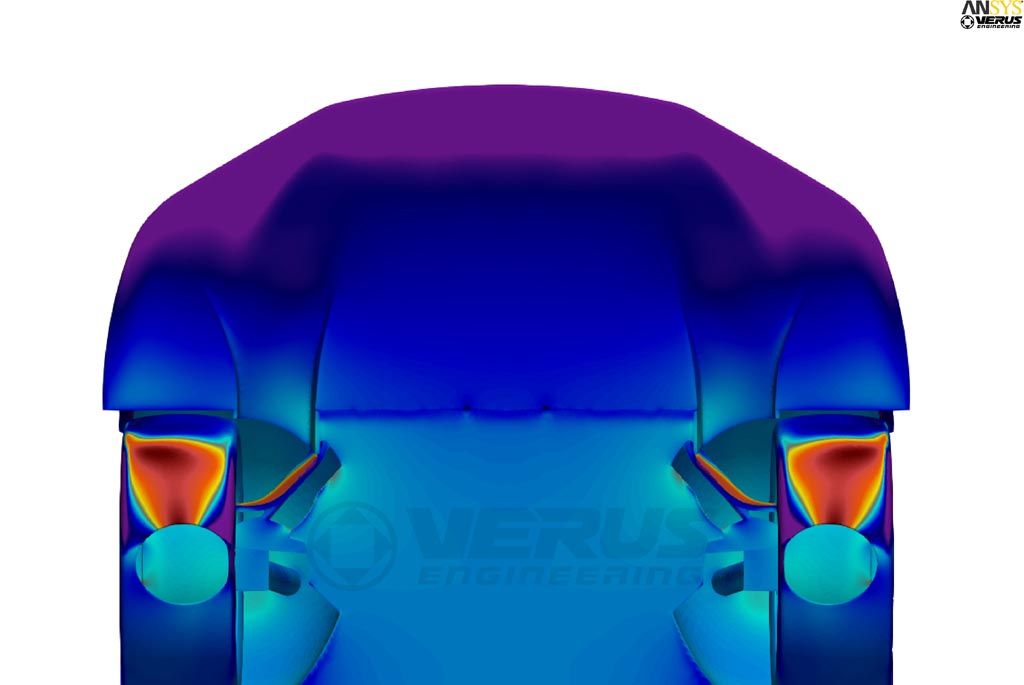
The bottom side of the splitter is now shown where lots of low pressure can be seen. You can also see how the new front diffusers affect the rest of the flow field.
Surface LIC
Now I will show you how we can use a CFD post-processing view to compare to real-world testing. Surface LIC, or Line Integral Convolution, shows the fluid flow on the surface of the vehicle. To compare to the real-world results, we would use oil flow or flow vis.
For math inclined people, the equation to show this is below. Since we are looking at the surface of the car, we need a vector on the surface. Velocity cannot be used since the velocity on the wall is 0. We use wall shear stress.

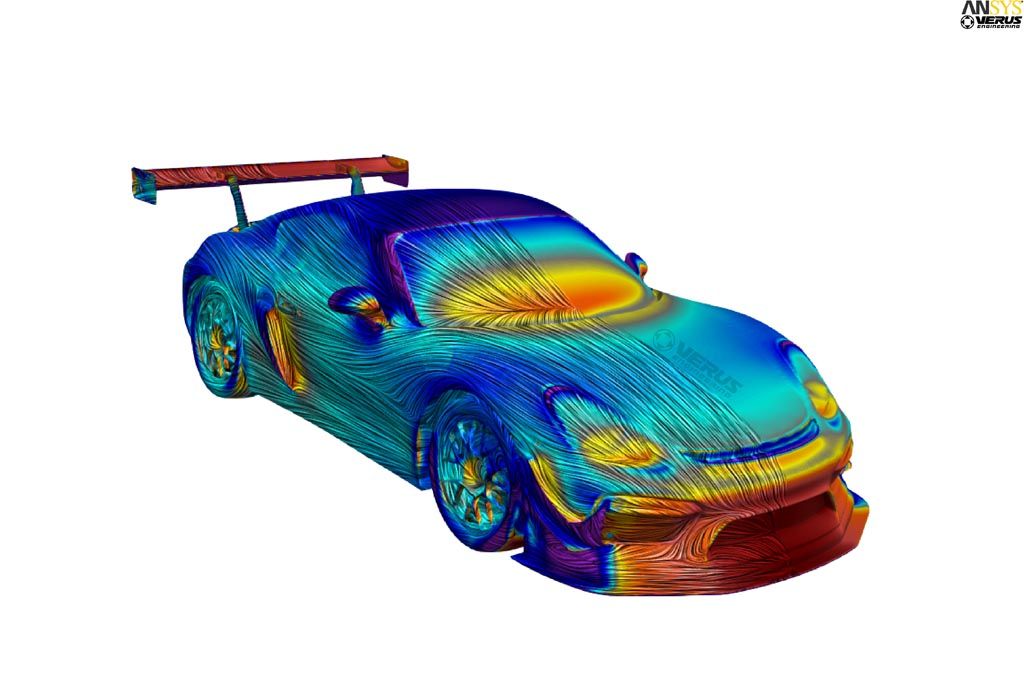
With this plot, we can understand how the flow is behaving on the vehicle’s surface to better improve our designs. We have also used these plots to correlate our rear wing to real-world flow viz testing as well as various other components on the Porsche 987. Correlating our CFD data to real-world results ensure we are analyzing components accurately, our meshing quality is appropriate, and ultimately the results from CFD are accurate as well.
Velocity Plot
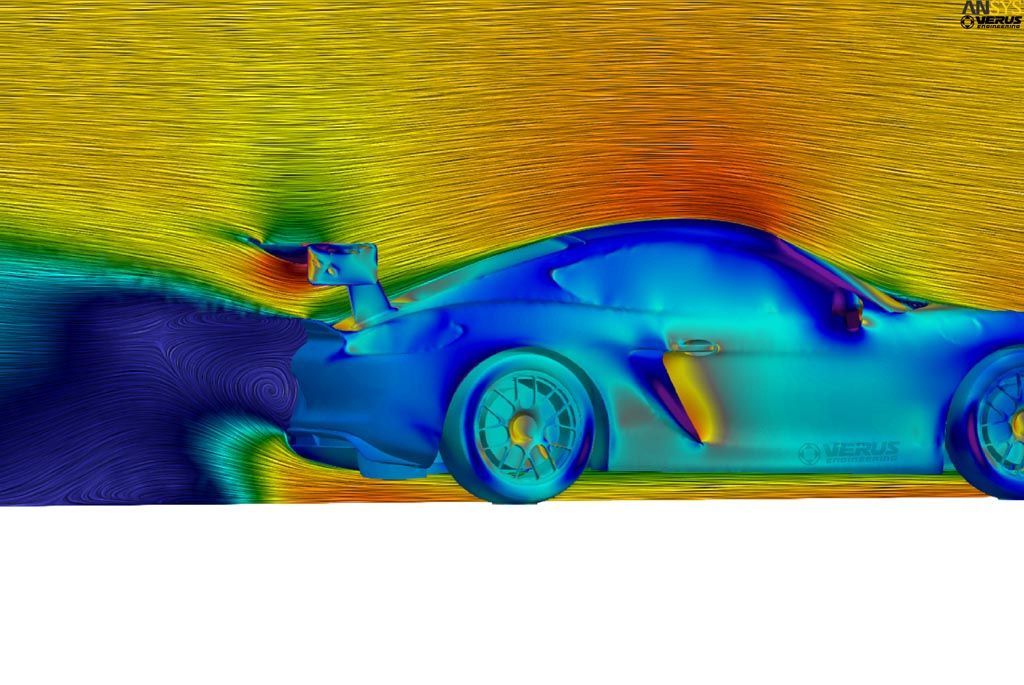
The velocity cut plot is next which is scaled in m/s. This is a slice plane taken out of the air and the color represents the velocity. The black lines show the fluid direction which is also an LIC plot. This plot uses vectors of velocity instead of wall shear. We can use this plot to gain information on how the airflow is flowing around the vehicle.
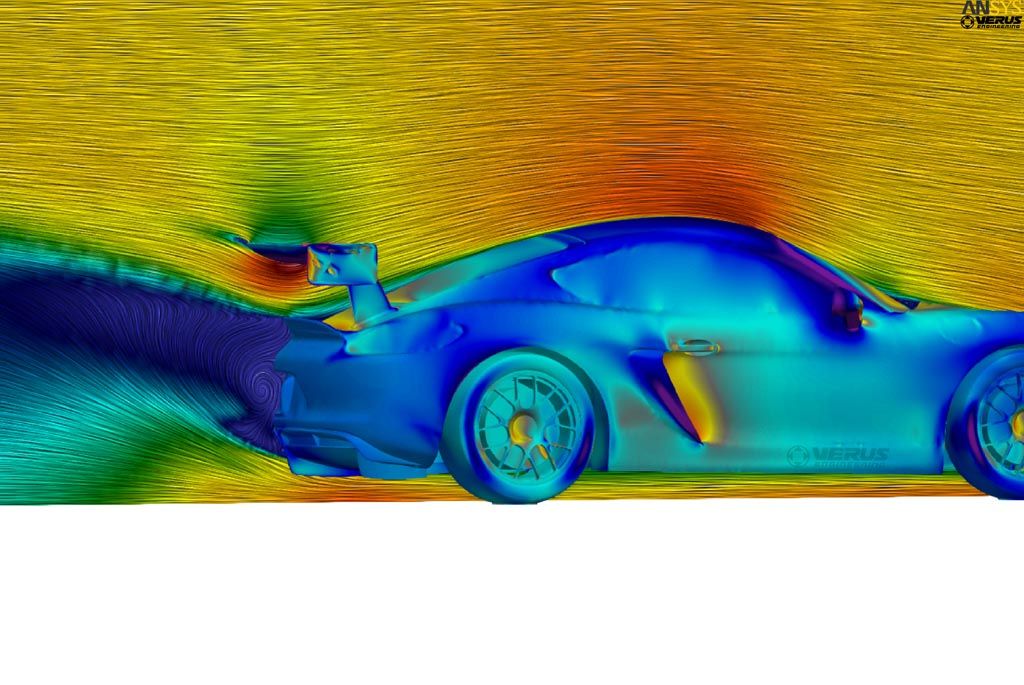
The dead water region (blue separation on the rear) can easily be seen. You can see the recirculation right around the license plate. This dead water region is pretty small because of how our diffuser improves the flow behind the car. The different slice location just shows the same data but in a different location on the car. The one below is 250mm from the centerline while the first one was 100mm from the centerline.
Coefficient of Total Pressure
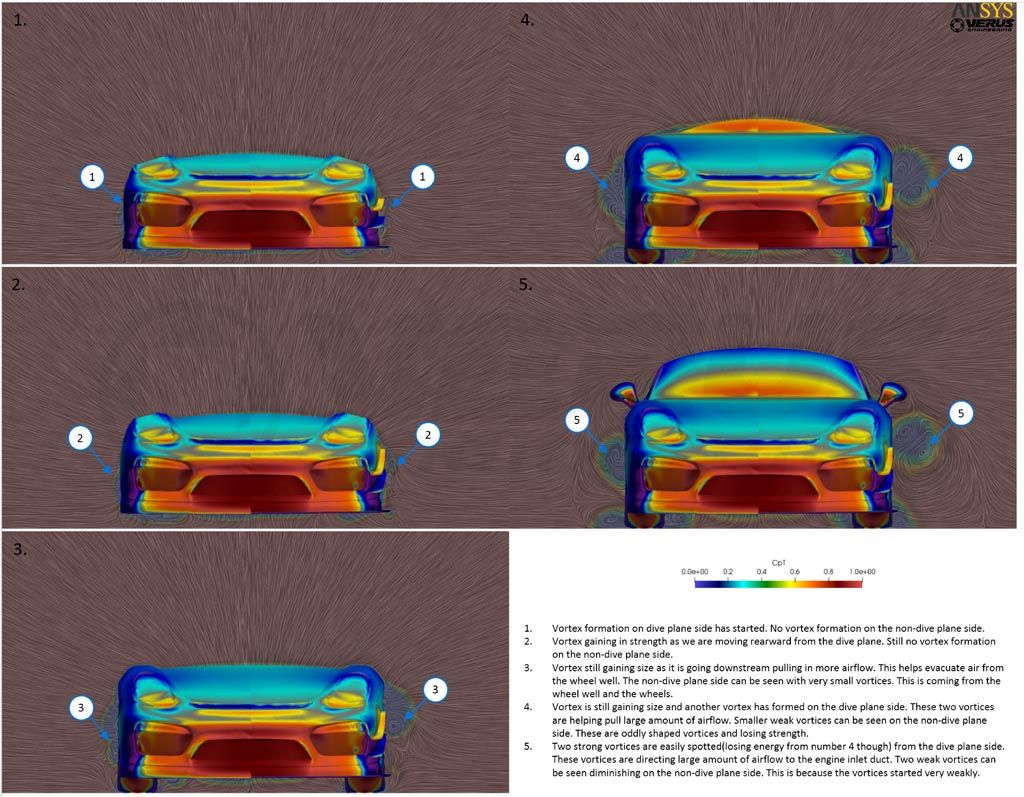
The next plot we will show is the coefficient of total pressure. This is a great way to see flow structures around the car which are important for performance, like vortices. Red, in this case, shows that no energy from the airflow is being extracted; while blue signifies most of the airflow’s energy is being utilized. The black lines once again show fluid flow direction on the cut plate.
Two vortices can be seen forming from the dive planes here and we can see how it changes downstream in the flow field. We specifically tweaked the dive planes on this specific car to have a better flow to the engine intake inlet duct.
Streamlines
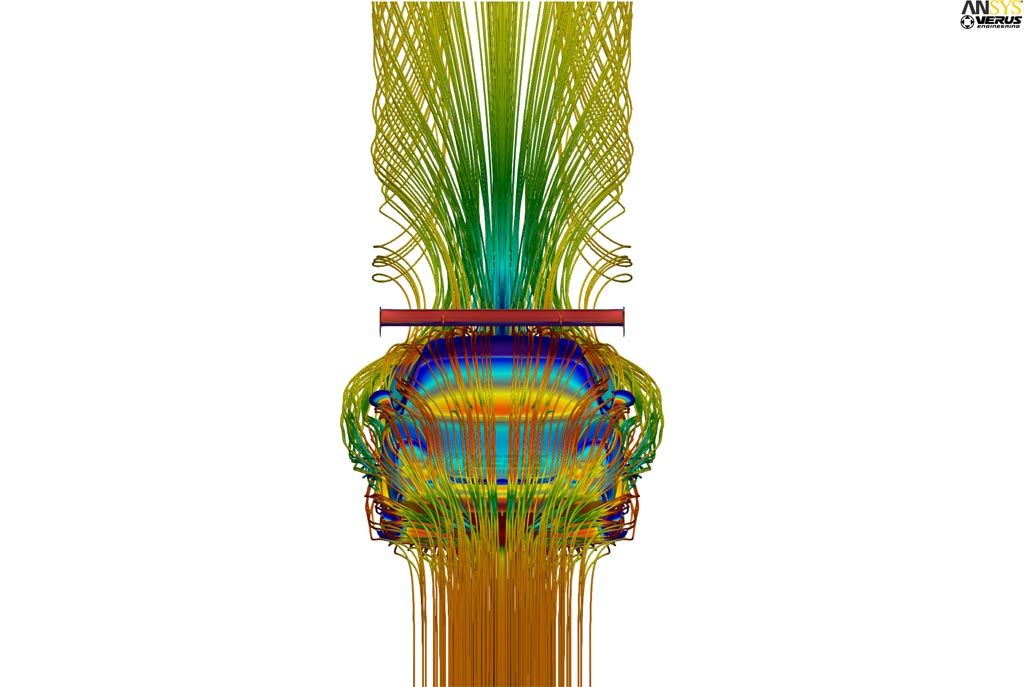
The last type of post-processing we will look at is streamlines. This is a pretty popular one since it makes pretty images. The streamlines show how the vehicle would displace the air as it drives. The streamlines are colored in velocity to see the speed in different areas. The underbody streamlines are great to see how the underside of the car affects the air it is displacing. The dirty air from the rear tire can easily be seen. The height at which the streamlines go behind the car is very impressive. This shows how well the rear diffuser and rear wing are working together.
CFD Post Processing